Lessons from a decade of failed austerity
Policymakers are only very gradually conceding this interpretation of the wage crisis.
To date, official policymakers including the OBR and Bank of England in the UK have not considered that weak demand might be causing low wages. Rather, the preoccupation has been whether occasionally higher wage growth indicates too strong demand. This view has very real implications. Not only is fiscal policy permanently set to austerity, but there is an ever-present threat of monetary policy tightening and further holding back growth and wages. This reversal is effected through near-exclusive focus on the supply side of the economy and the related idea of capacity.
The supply side of the economy
In most commentary, any failures of the economy are regarded as failures of the supply side (also known as structural factors). The idea of a ‘productivity puzzle’ reflects the difficulty of explaining productivity outcomes since the financial crisis. A vast literature addresses the potential role of for example poor capital stock, bad management, ‘zombie companies’ or poor skill levels in the workforce.[1] In spite of failing to resolve the puzzle, policy proceeds on the basis of the supply-side view.
Government action to improve outcomes is based on an industrial strategy and the newly convened Industrial Strategy Council. Plainly there is much wrong on the supply side of the economy: a financial system that fosters speculative excess rather than productive advance, an absence of industrial planning, limited regional and sectoral policies, attacks on trade unions and inadequate support for upskilling. Trade unions have long supported the development of industrial strategies.
But these defects long predate the global financial crisis and austerity, and do not explain what changed after 2008. As above, in the context of the weak economic growth experienced by the UK and other countries since the global financial crisis, productivity statistics show effect not cause.
The output–gap
The exclusively supply-side analysis is a barrier to policy change going forward. Under the basic (and long-standing) framework for monetary and fiscal policy, the economy is understood in terms of both demand and supply conditions. Policymakers (in the UK, the BoE and OBR) project trajectories for both supply and demand growth into the future; the trajectory for supply is known as ‘potential’ and the difference with demand is the ‘output gap’.
The output gap is understood as a measure of capacity, i.e. the ability of an economy to grow without causing inflation. A zero or positive output–gap indicates there is no spare capacity. In practice policymakers operate according to their assessment of the contemporaneous output gap. If demand is sustained below potential, expansionary policy will improve outcomes; when demand is sustained above potential, contractionary policy is necessary to avoid inflation. The charts below are a stylised representation of the OBR projection over the first five years of austerity, and their revised view five years later.
[1] E.g. ‘Four theories to explain the UK’s productivity woes’, Gemma Tetlow, Financial Times, 23 October 2017: www.ft.com/content/b6513260-b5b2-11e7-a398-73d59db9e399. In his Spending Review 2019 speech Sajid David made the usual appeal: “And we need to raise our productivity – the amount that’s produced every hour worked. That isn’t just some technical term. Slower productivity means lower wages and uneven growth across the country”.
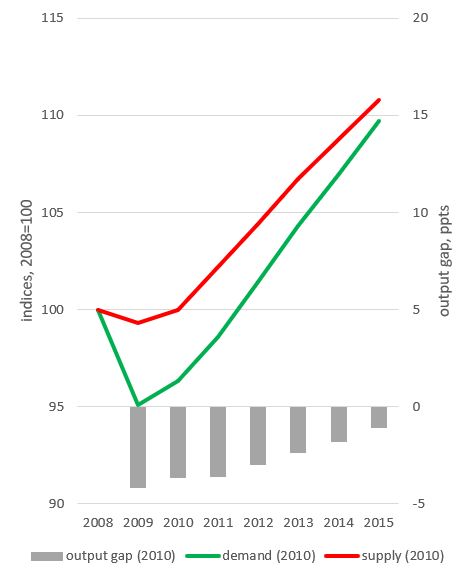
Figure 20b: OBR changed view five years later
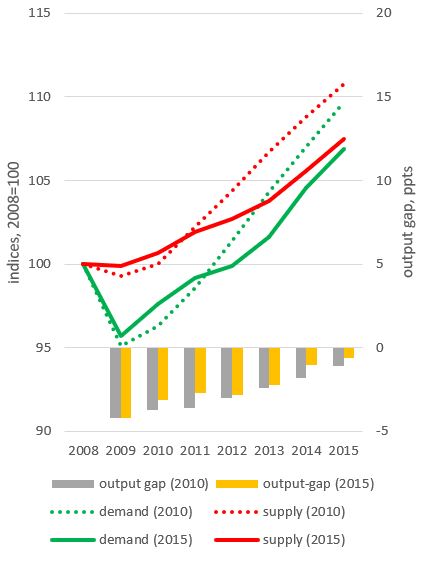
Over the first austerity parliament from May 2010 to May 2015, the OBR expected rising demand to steadily to close the gap with potential supply (Figure 20a). In reality (measured at the start of the new parliament in 2015) demand growth came in significantly lower than expected; and the OBR simply revised potential downwards to match. This follows the supply-side interpretation of productivity outcomes. In fact, the less negative output gap indicates that supply was revised by even more than the demand shortfall. Under the demand view, there is no reason to change the previous view of supply, and instead the output gap should be larger – i.e. more negative.
Under the demand view, the government should act to provide additional support to the economy. Under the supply view, any additional support will lead to inflation and so government expenditure cannot be further expanded.
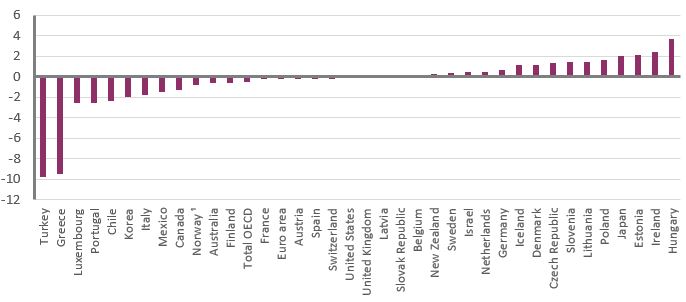
For the past five years or so, both the Bank of England and OBR have considered the output gap effectively closed and the economy operating at capacity. This assessment is common to the majority of countries, see for example the latest OECD assessment of advanced economies for 2019 (Figure 21). The overall OECD output gap is marginally negative gap at -0.5; two thirds of countries are considered to have gaps close to or above zero.
Figure 21: Estimated output gaps in 2019, percentage of GDP
Even though the UK government claims that austerity is over, on this view there is no capacity for any substantial increase in the level of government expenditure without causing inflation.
There is now a wider backlash against the way output gaps have been deployed by policymakers, not least in the context of the tensions between the EU and Italy on fiscal policy. The historian Adam Tooze goes as far as arguing: “output gap estimates, in short, are politics pursued by the technical means of economics”.[1] He exposes how basing projections of potential on averaging historic experience has “truly perverse effects”. Over the past decade policymakers have used economics to affirm and re-enforce austerity, rather than assess impartially whether the approach has been wrong. Austerity economics is political.
The natural rate of unemployment
The other perspective on capacity is unemployment. According to the theory of the non-inflationary rate of unemployment (‘NAIRU’), when unemployment falls below a certain threshold wage inflation and then price inflation will be triggered.
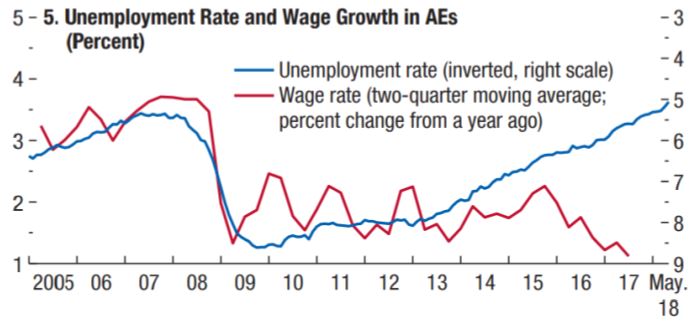
But the present situation is characterised by the reverse process: employment gains and equivalently unemployment falls are occurring alongside wage declines. The IMF (2018 - below) show this is the norm across advanced economies: unemployment has been steadily falling since 2013, but wage growth had been shrinking since 2015.
[1] ‘Output gap nonsense’, 30 April 2019. www.socialeurope.eu/output-gap-nonsense
Outcomes have been opposed to the theory of the NAIRU. As a result, policymakers are having repeatedly to reassess the natural rate of unemployment. In remarks around a year ago, Andy Haldane (chief economist at the Bank of England) observed “Over recent years, the Bank has revised down its estimate of the NAIRU in the UK, by just under a percentage point, to around 4 ¼%”.[1] Others make the point that the increased levels of under-employment mean natural rates must be greatly lower.[2] But the logic that permits the natural rate to be a moveable feast must therefore set no necessary lower bound to the natural rate, not least because unemployment has been as low as 1 per cent in the past. More generally, the idea of a natural rate of unemployment is obviously problematic for trade unions; others are now catching up. As Matthew Klein argued in the Financial Times: “in addition to being morally odious, the theory is empirically unsupportable and is increasingly questioned by a younger generation of central bankers”.[3]
Inflation and supply capacity
Under present conditions the only possible justification for assuming supply as the key factor would be the actual manifestation of inflation. But as Figure 22 shows, core inflation (excluding energy and food) has been dormant across all advanced economies for a decade and a half. The UK performance has diverged, albeit not greatly, mainly as a result of sterling devaluations and also changes to VAT. Fundamentally the position is consistent with demand – not supply – weakness.
[1] www.bankofengland.co.uk/speech/2018/andy-haldane-advisory-conciliation-and-arbitration-service-future-of-work-conference. Martin Beck at Oxford Economics (‘Next PM could shift policy gears to spur the economy’, 10 June 2019) points out that in 2013 the Bank thought the NAIRU was 6½ per cent.
[2] ‘Underemployment in the US and Europe’, David Bell, David Blanchflower, VOXEU, 24 September 2018, https://voxeu.org/article/underemployment-us-and-europe
[3] ‘NAIRU: not just bad economics, now also bad politics’, Matthew Klein, Financial Times Alphaville, 24 January 2018. ftalphaville.ft.com/2018/01/24/2198028/nairu-not-just-bad-economics-now-also-bad-politics/
Figure 22: ‘Core’ inflation, per cent
Stay Updated
Want to hear about our latest news and blogs?
Sign up now to get it straight to your inbox