
10 ways that show the economy isn’t working for working people
Ten years of weak growth and under investment have been exacerbated by the Hobson’s choice of Boris Johnson’s hard Brexit or a disastrous no-deal Brexit.
Cut to vital local government funding and public services, falling real pay and stagnant wage growth and rising child poverty and food bank usage are all part of a toxic cocktail of challenges facing working people.
It’s clear that the outgoing government has not stood up for working people and their families.
But just how bad are things? We’ve put together ten ways in which the economy isn’t working for working people.
Economic mismanagement
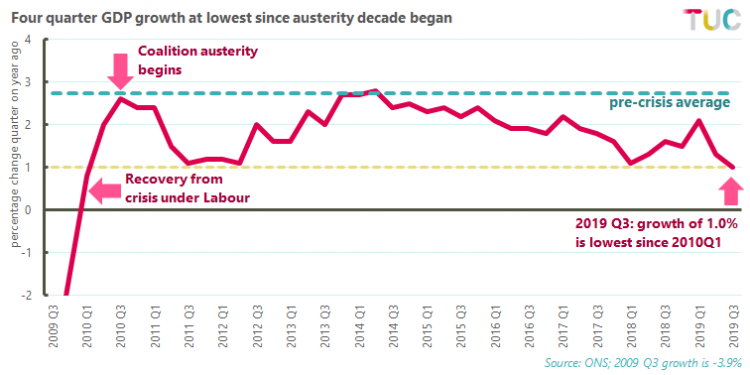
1: Stagnant growth
The easiest way to measure the size and health of the economy is to look at GDP (Gross Domestic Product) growth.
Boris Johnson recently boasted that the economy is ‘strong and growing’, but this is far from reality.
The latest GDP figures from November show the lowest growth since 2010 – well below half the long-term average.
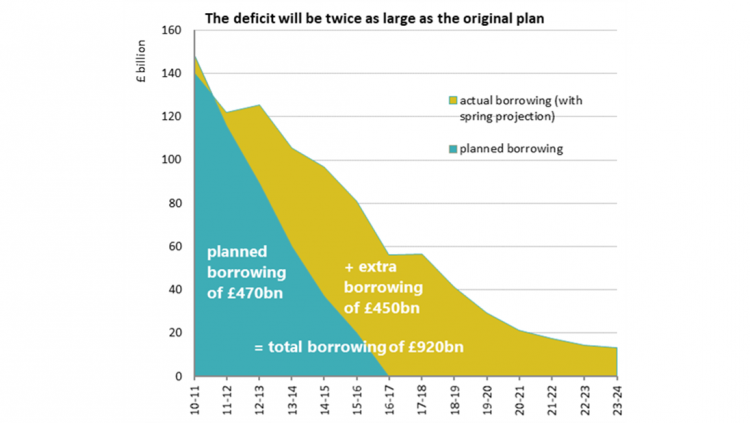
2: Broken public finances
We were told austerity was necessary to reduce the deficit, but the government missed every target it set for deficit reduction.
As a result, by 2023/24 the cumulative deficit will be twice the governments original plan.
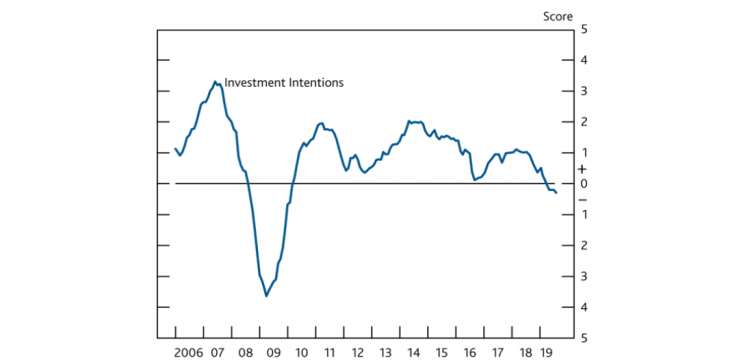
3: Slump in investment
The Bank of England recently warned that business investment intentions continue to weaken and remain at a 9 year-low.
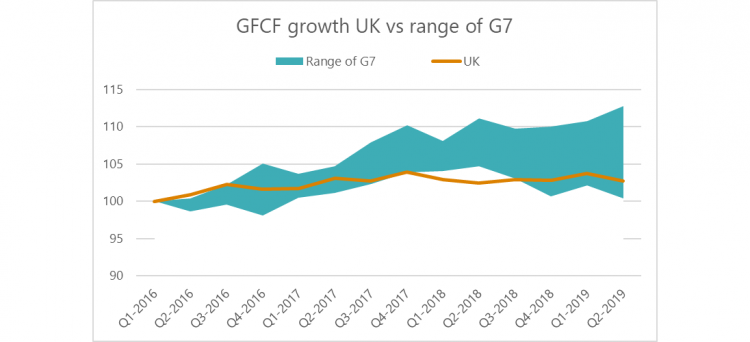
Low investment in the UK is nothing new. Since the start of 2016, the UK has seen some of the slowest net investment of the G7 economies.
UK GFCF (a measure of government and non-government investment) has increased 2.8 per cent versus the G7 average of 7.6 per cent.
A Crisis of work.
4: Work is no longer a route out of poverty
As the UN Rapporteur stated in his report on poverty in the UK, work is no longer a means to ending the poverty trap.
The number of people in working households who are living in poverty has risen from 5 million to 8 million over the last 15 years.
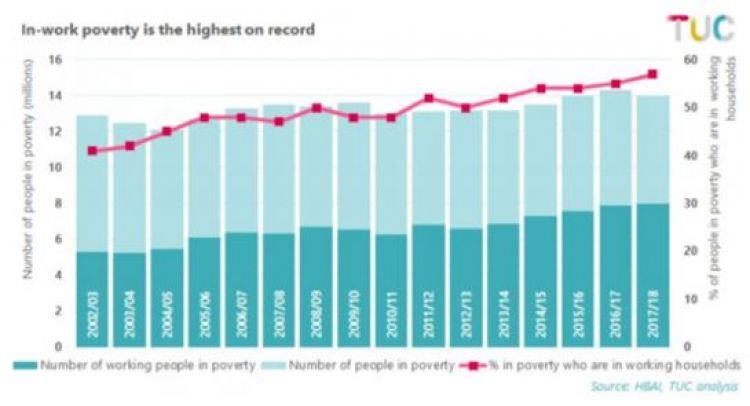
And the number of children from working households living in poverty stands at 2.9 million - a rise of 800,000 since 2010.
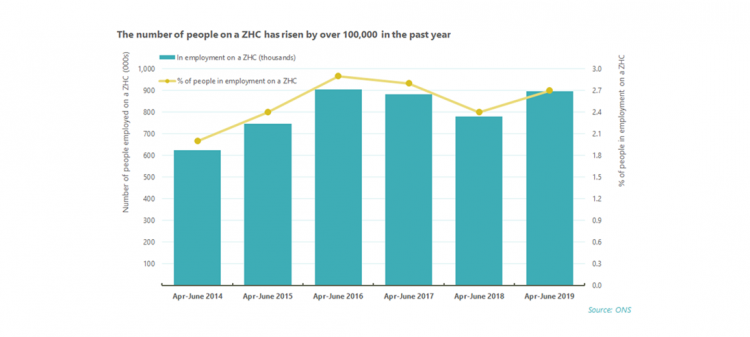
5: Employment may be high – but so is insecure work.
There are now 900,000 people on zero hours contracts with no guaranteed income. This has risen by 100,000 in just the last year.
The worst pay crisis for two centuries.
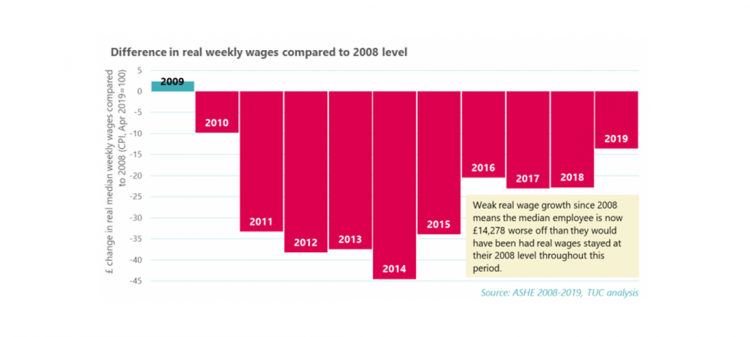
6: A crisis of pay
The last ten years have been characterised by falling and stagnant pay for many working families.
Real pay (adjusted for inflation) has still not recovered to pre-2008 levels.
In total the average worker is still over £14,200 worse off now than if real wages had remained at 2008 levels.
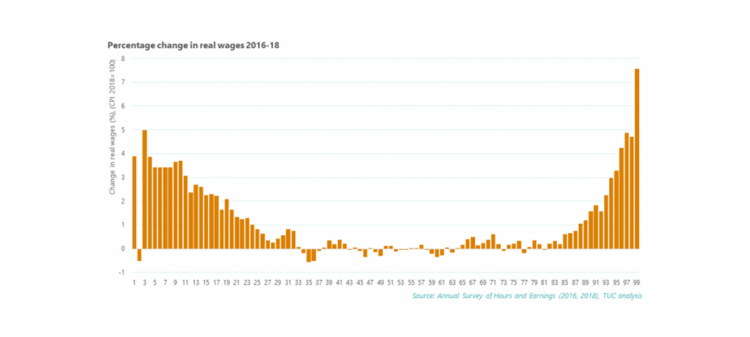
Meanwhile, as working families continue to struggle with sluggish wage growth, pay for the highest earners has recovered much faster than for everyone else.
Since 2016, pay for the top 1 per cent has increased by 7.6 per cent (the top 1 per cent typically earn £160,000, the top 0.1 per cent earn £650,000 or more).
By comparison, the typical worker (earning around £22,000) has seen theirs grow by a dismal 0.1 per cent.
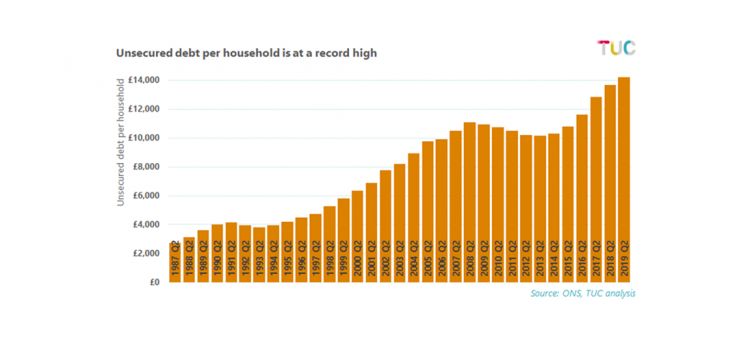
7: Household debt is soaring
Struggling to make ends meet, many families and young people are grappling with the burden of unsecured debt (credit cards, overdrafts, loans).
The average household debt is now £14,200 and 1 in 10 households are heavily burdened with debt repayments.
Communities and families devastated by austerity
8: Poverty
Despite being one of the richest economies in the world, poverty in the UK persists.
Many of the reforms to social security have pushed families and working people below the breadline.
This means that today in the UK:
- 14 million people live in poverty
- 4.1 million children are living in poverty
- 57 per cent of those living in poverty are from working households
- The Trussell Trust network of food banks alone gave out 1.6 million food parcels last year.
The UN’s damning report on poverty in the UK concluded that the approach taken to welfare and other reforms has been ‘punitive, mean spirited and often callous’.
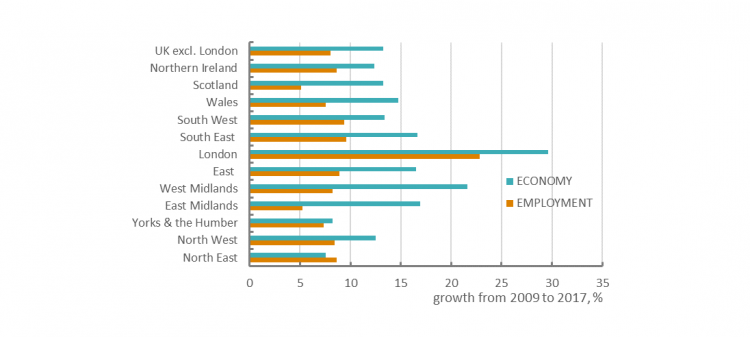
9: Regional imbalances
Between 2010 and 2017 there was much higher economic and employment growth in London compared to the rest of the country.
In fact, the economy and employment in London grew more than twice the rate of everywhere else.
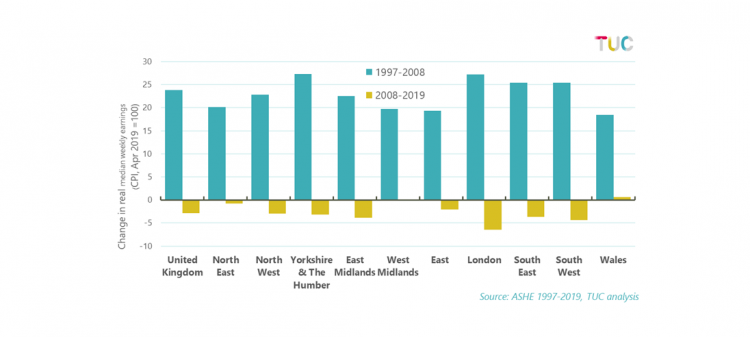
Despite more economic and employment growth, London has been plagued with falling real weekly wages (just like everywhere else).
In the ten years before the financial crash, real wages were growing in every region of the UK.
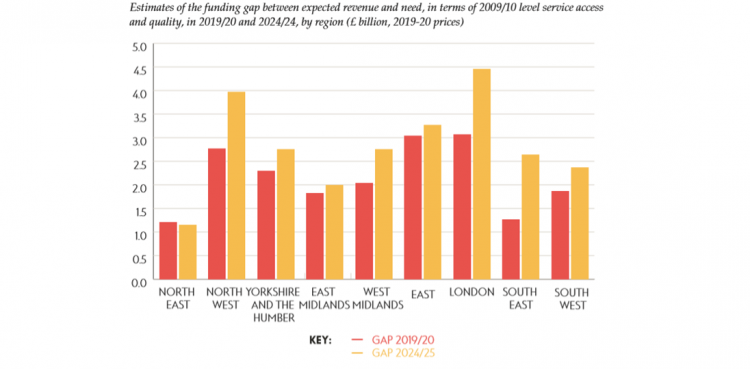
10: Local authority cuts
Local authorities provide many of the vital services we rely on.
Since 2010 non ring-fenced funding has been cut by 86 per cent (£27.6bn), resulting in cuts to essential social care and mental health provision and closures of vital community assets such as libraries, children’s and community centres.
Councils face a funding gap of £25.4bn by 2024/25.
This record of failure has damaged the social fabric of our communities, putting more pressure on vital services, communities and working people.
That’s why we believe it’s time to put working people first and get the economy working in the interests of all us.
Stay Updated
Want to hear about our latest news and blogs?
Sign up now to get it straight to your inbox